Understand your data like never before
BI Reporting turns plain-English questions into live charts, sortable tables, and AI-generated insights, so your team can explore data without writing SQL or building dashboards from scratch.
Analytics built for how you actually work with data
Upload your datasets, ask questions naturally, and get interactive charts, sortable tables, and AI-generated summaries, ready to export or share with your team.
Instant insights
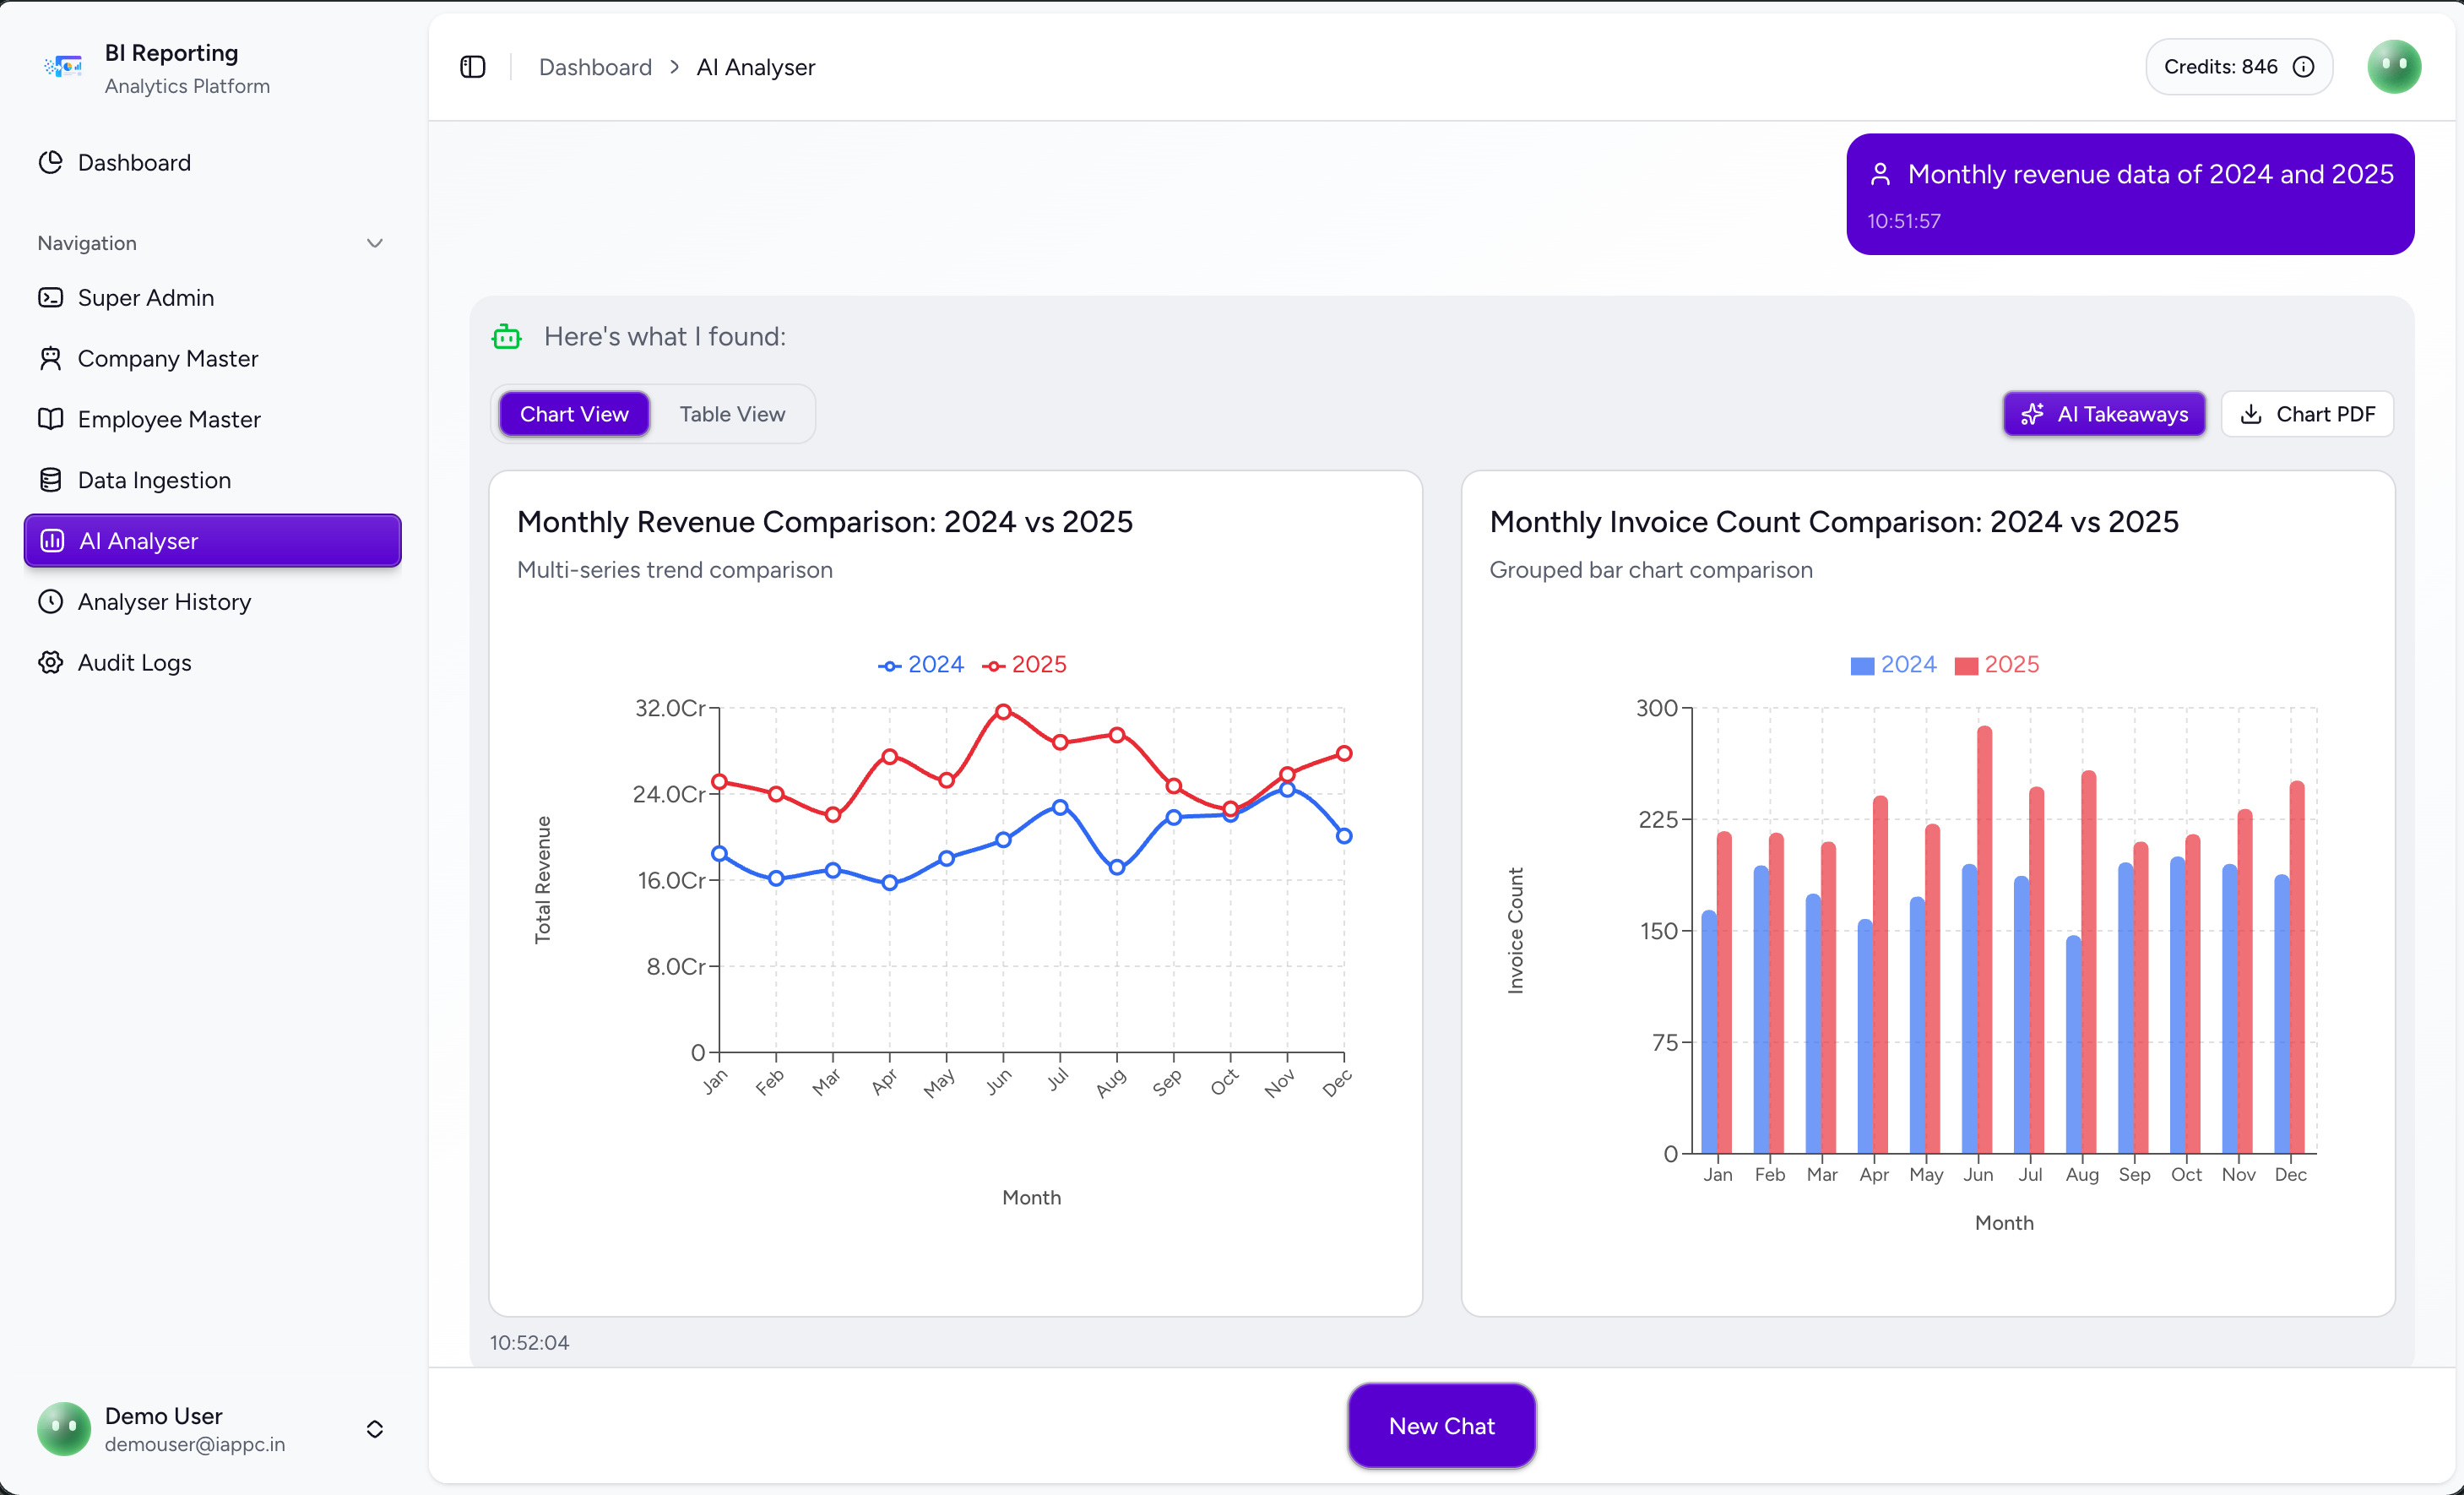
Ask in plain English and get charts and tables in seconds, with no SQL or dashboard setup required.
Rich visualizations
Bar, line, pie, and doughnut charts generated automatically from your query results.
Structured tables
Every analysis includes filterable data tables alongside visualizations for deeper exploration.
AI takeaways
Get key insights summarized by AI, export reports to PDF, and revisit past analyses anytime.
One workspace for every analysis
Run natural-language queries against your ingested datasets and get charts, sortable tables, and AI summaries, all in a unified dashboard.

Frequently Asked Questions
Everything you need to know about AI-powered analytics with BI Reporting.
Ready to explore your data? Sign in to get started